Project
The Bogner Projection
I created the transition using the D3 Javascript library based on Mike Bostock's work.
TL;DR
I wanted to fully understand what it means to create a map projection, so I created my own:
Humbly called The Bogner-Projection™
Jokes aside this was a great exercise to understand map projections on their lowest level:
Very simply spoken, polar coordinates (i.e. longitude & latitude) go in, then some mathematic formula converts those into cartesian coordinates (i.e. x & y).
This is why every projection needs a different scaling to appear visually the same size.
Code comparison
function mercatorProjection(lon, lat) {
    const x = lon
    const y = Math.log(Math.tan(Math.PI / 4 + lat / 2))
    return [x, y]
}

function bognerProjection(lon, lat) {
    lon = lon * 180 / Math.PI
    lat = lat * 180 / Math.PI
    const amplitude = Math.abs(lat/180) - 1
    const maxX = 0.5 + 0.6 * Math.abs(Math.sqrt(1 - amplitude*amplitude))
    const normalizedLon = ((lon / 180) + 1) / 2
    const y = lat / 90
    const x = -1 + normalizedLon * maxX
    return [x, y]
}
Other projections
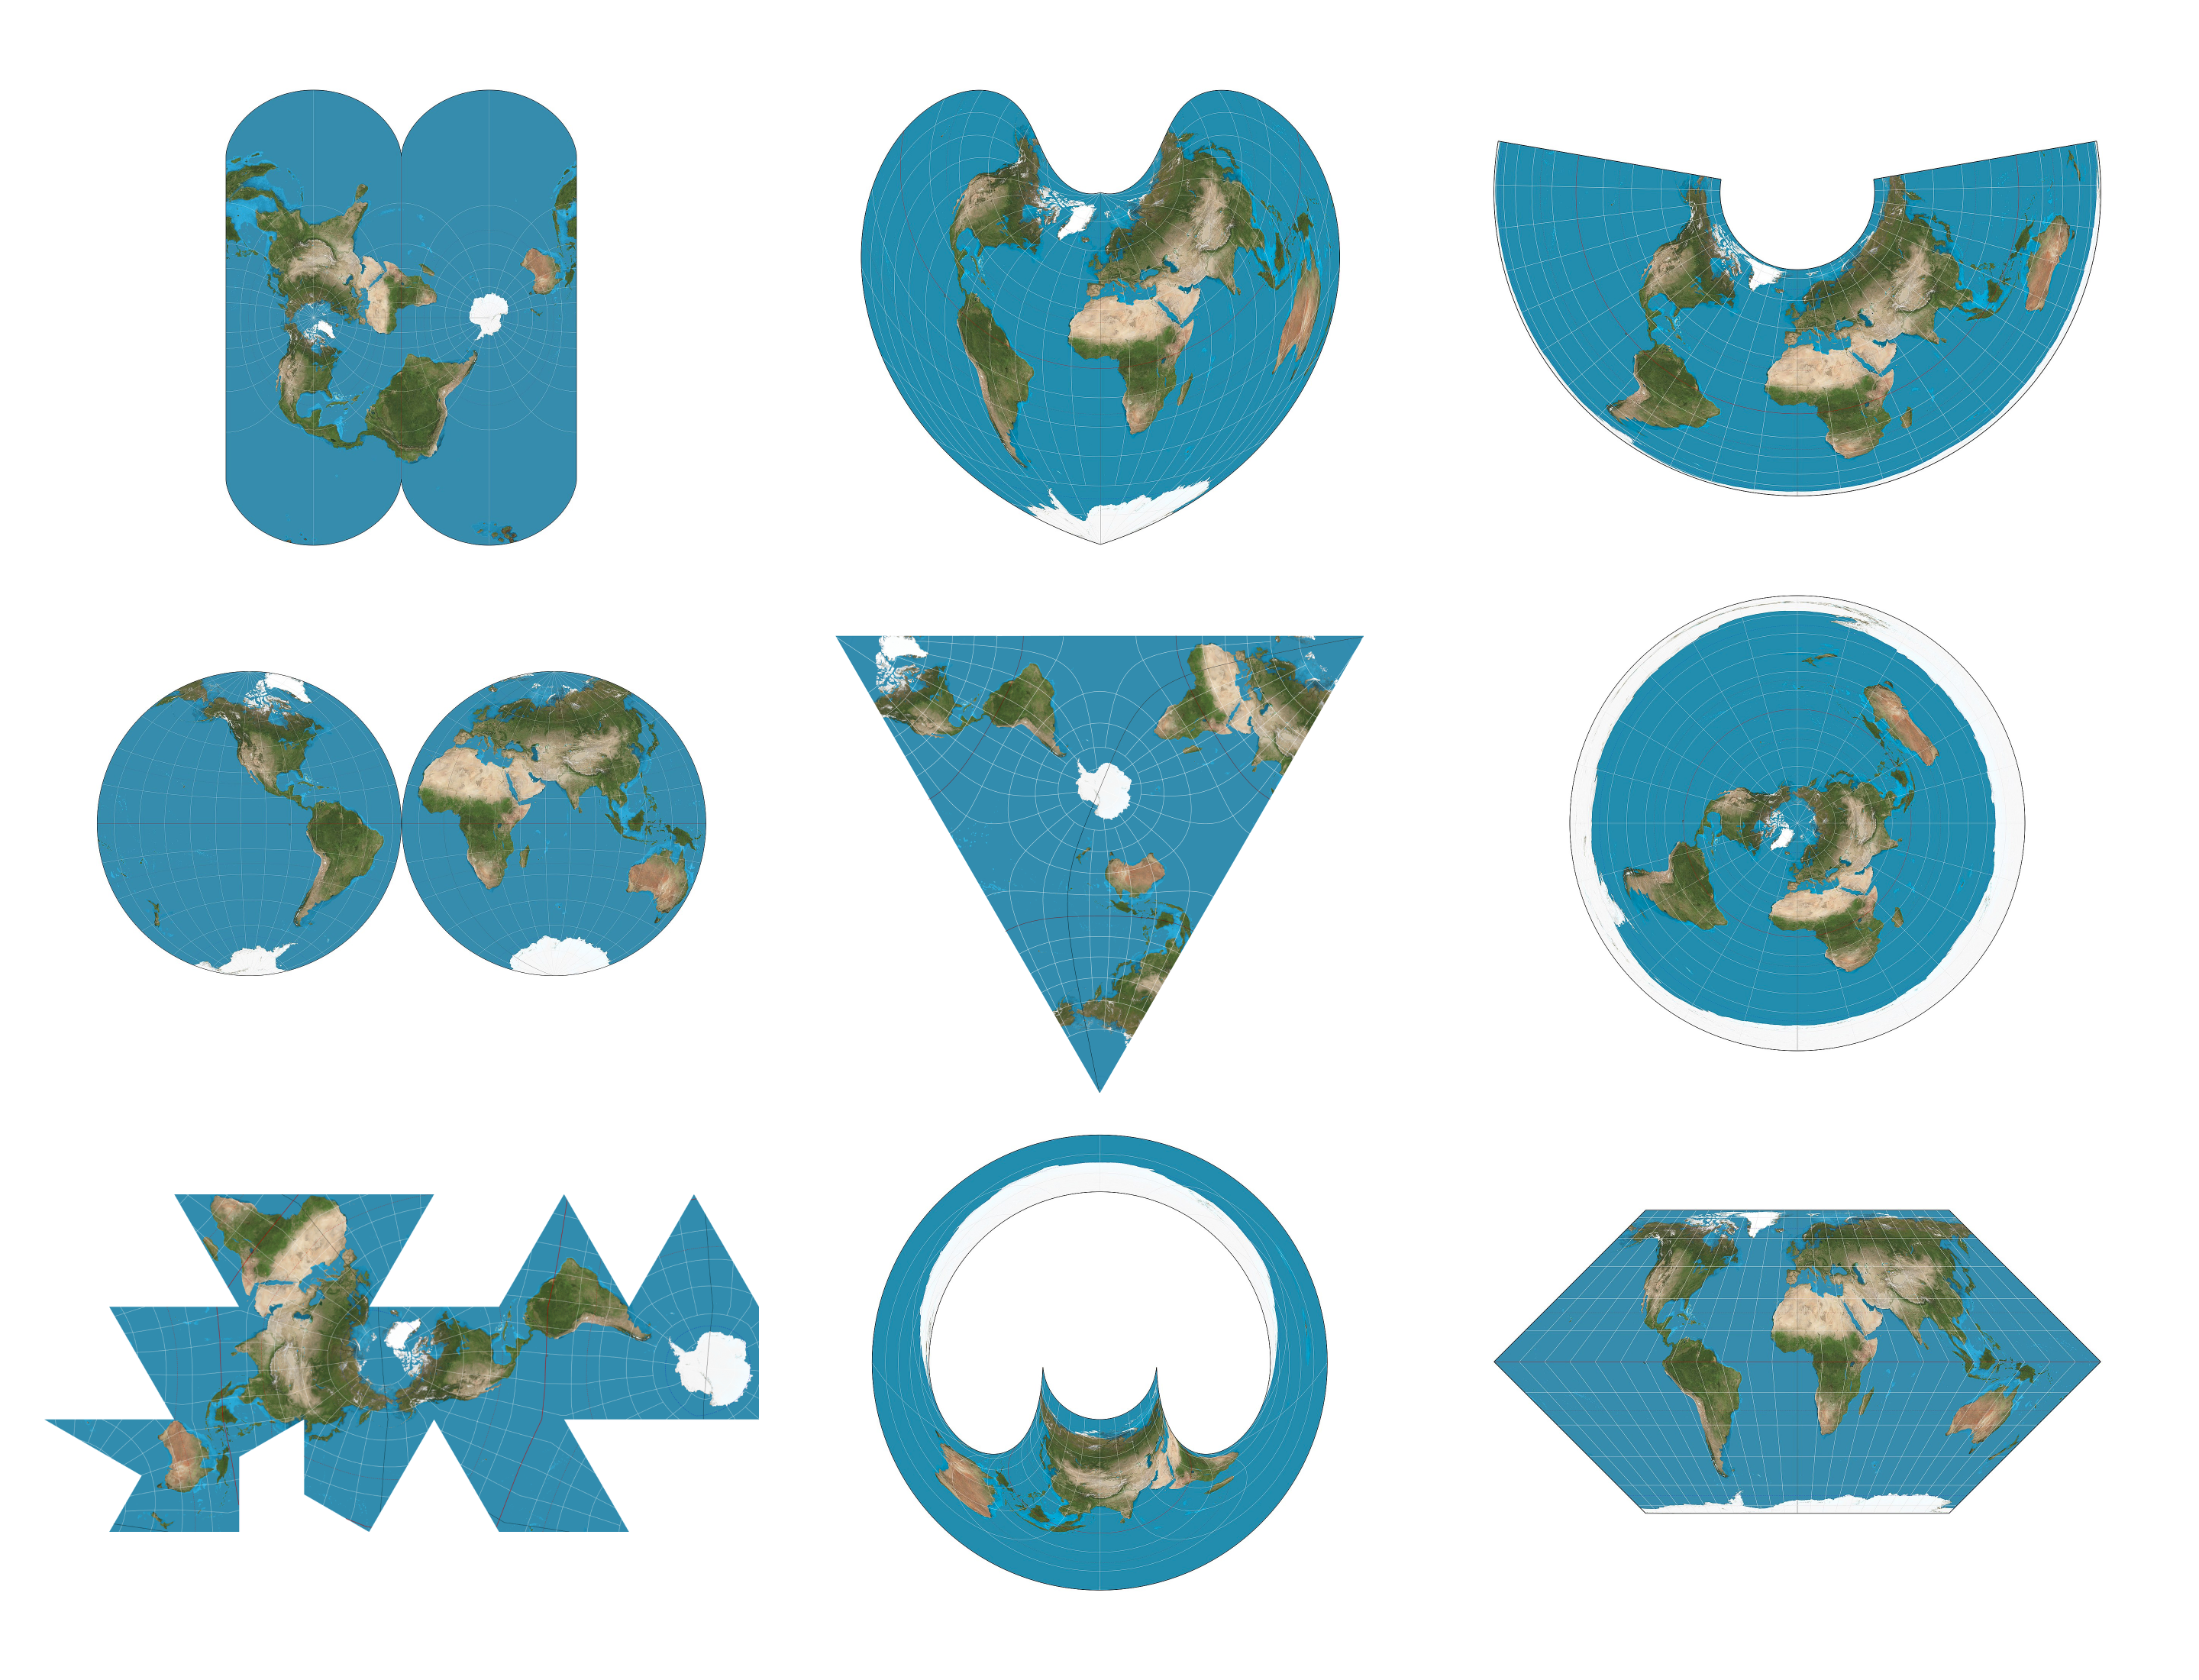
If you think my projection is weird, there are actually very unusual projections that serve special purposes (via Wikipedia):
Comments
Your thoughts?